
Full-screen view for individual visuals
Focus on key insights without distractions.
Core platform
SPIL Power BI Dashboards deliver real-time insights, interactive visualisations and seamless accessibility — transforming raw data into actionable intelligence so you can make smarter, faster decisions across sales, production and dispatch.
Overview
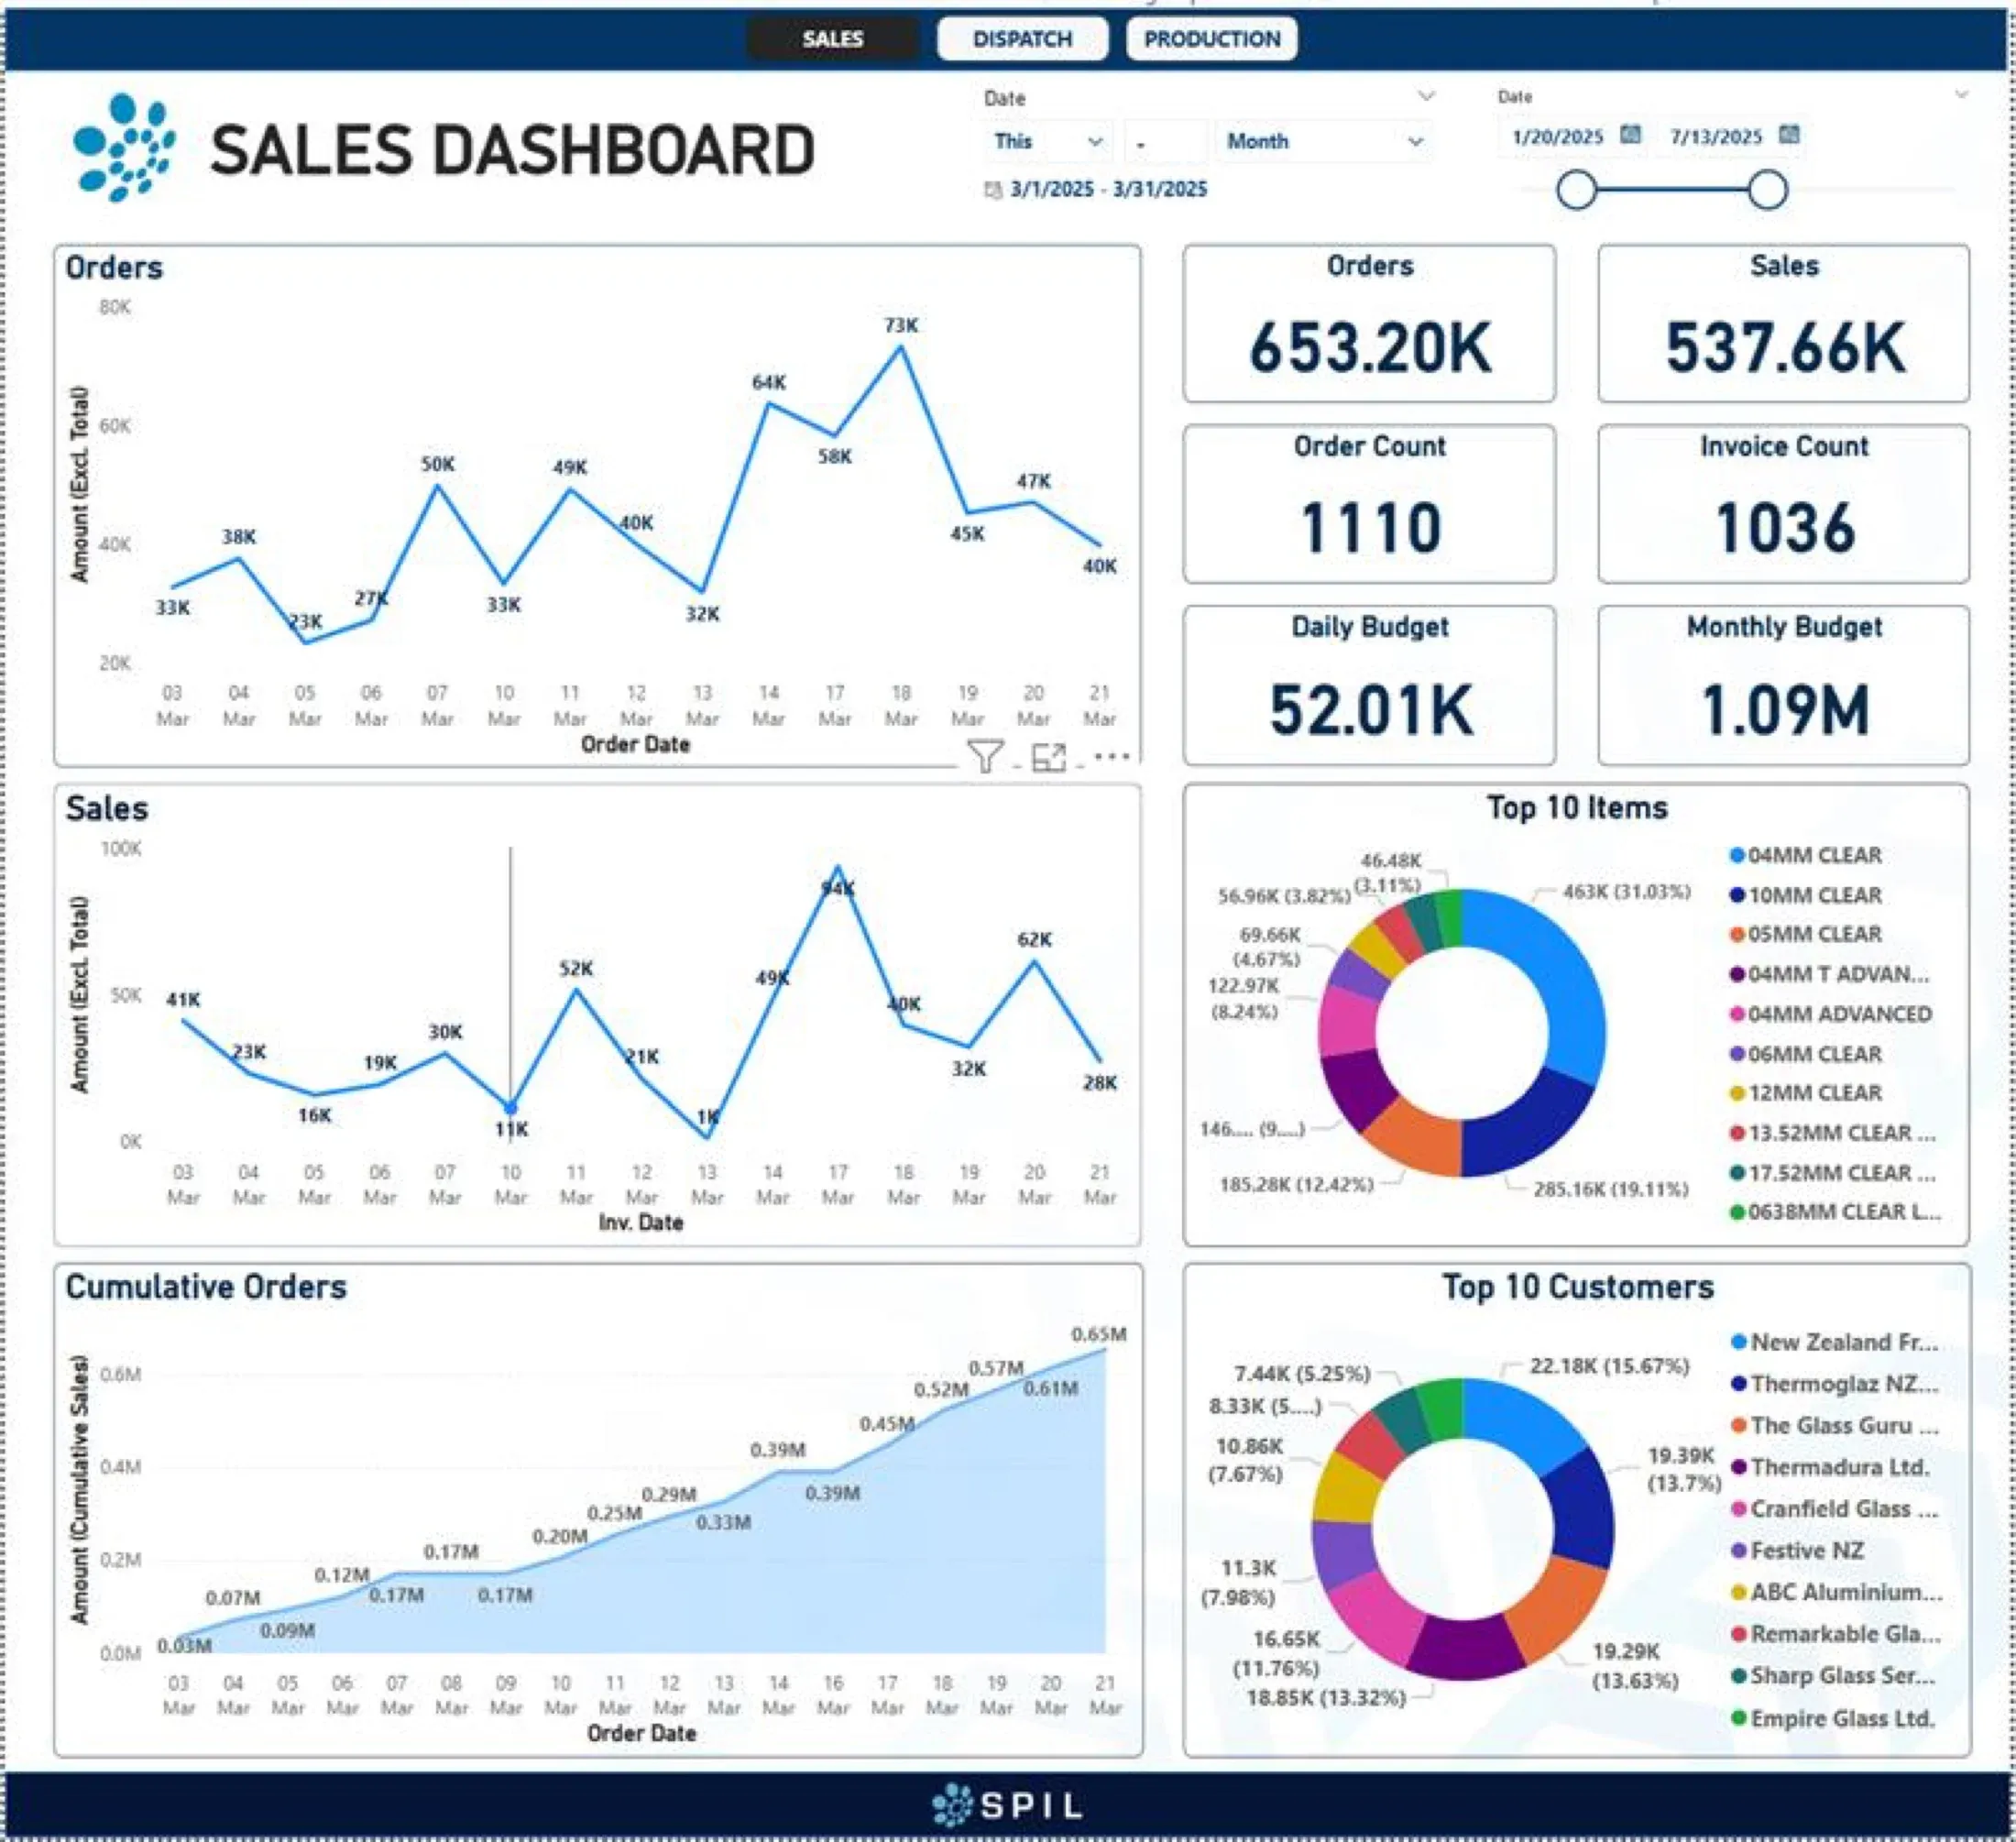
SPIL Power BI Dashboards are designed to provide real-time insights, interactive visualisations and seamless accessibility. Built with SPIL Power BI tools, they transform raw data into actionable intelligence for smarter, faster decision-making.
The latest enhancements make analysis even more efficient and user-friendly: focus on a single visual, share charts as images, get automated alerts by email and Teams, export to Excel, bookmark your favourite views and stay connected on mobile.
At a glance
Visuals update in real time, so the latest numbers are always at your fingertips.
Drill down and drill through from a headline figure to the detail in a few clicks.
Automated email and Teams notifications keep you informed on key metrics.
Mobile-optimised dashboards keep you connected to your data on the go.
Capabilities
Interactive Power BI dashboards for sales, production and dispatch — with drill-through, automated alerts, Excel export and mobile access.
Focus on key insights without distractions.
Easily share important data snapshots.
Stay informed with real-time notifications on key metrics.
Analyse your data beyond Power BI.
Stay connected to your data on the go.
Dive deeper into your data with a few clicks.
Get the latest numbers at your fingertips.
Save your most-used views for quick access.
SPIL BI dashboards
Web dashboards that turn SPIL data into a clear picture of sales, production, dispatch, inventory, receivables and customer SMS.
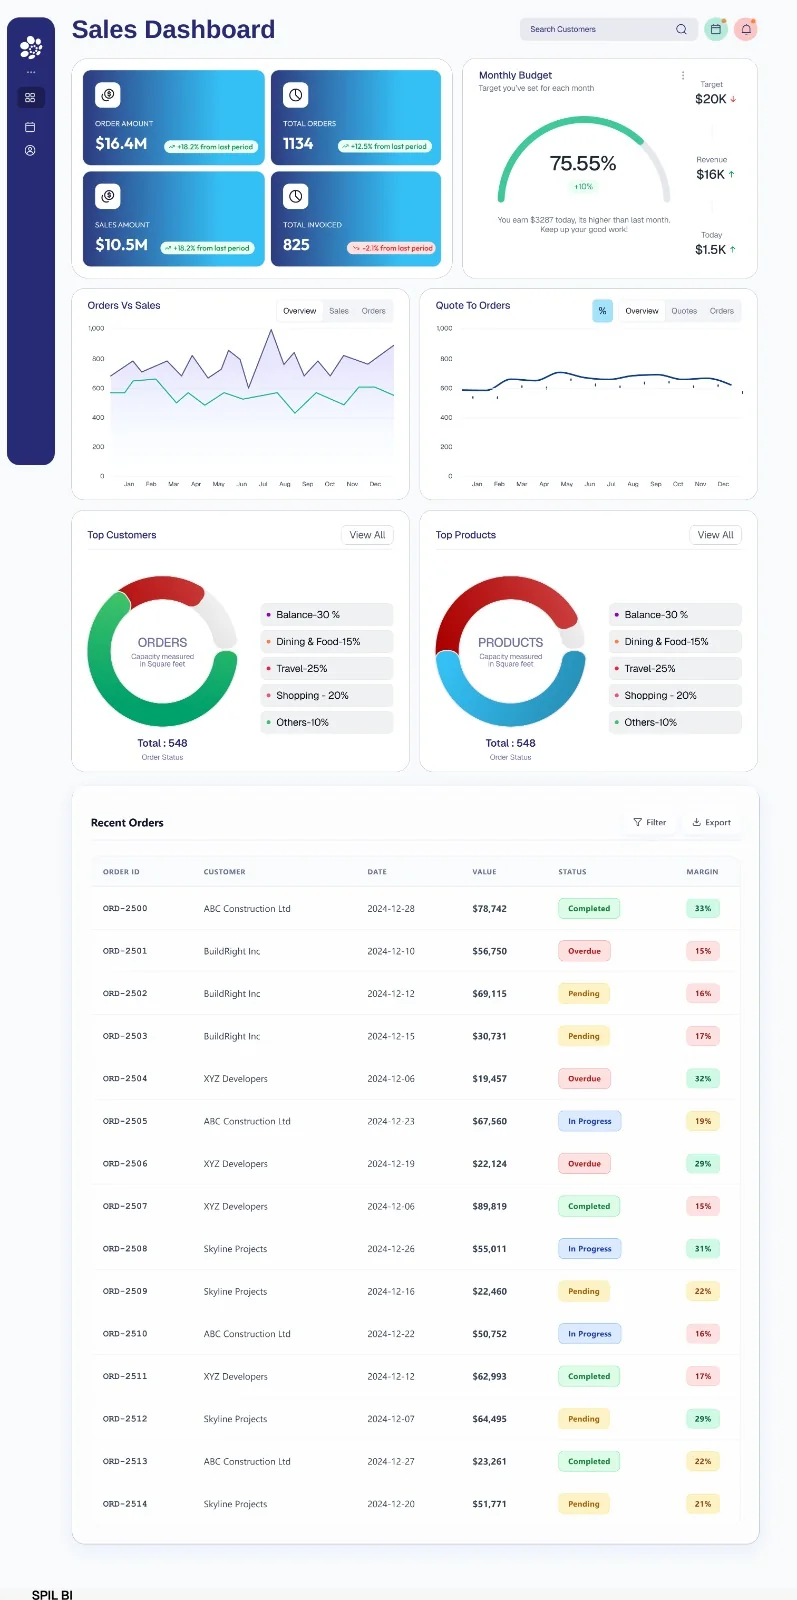
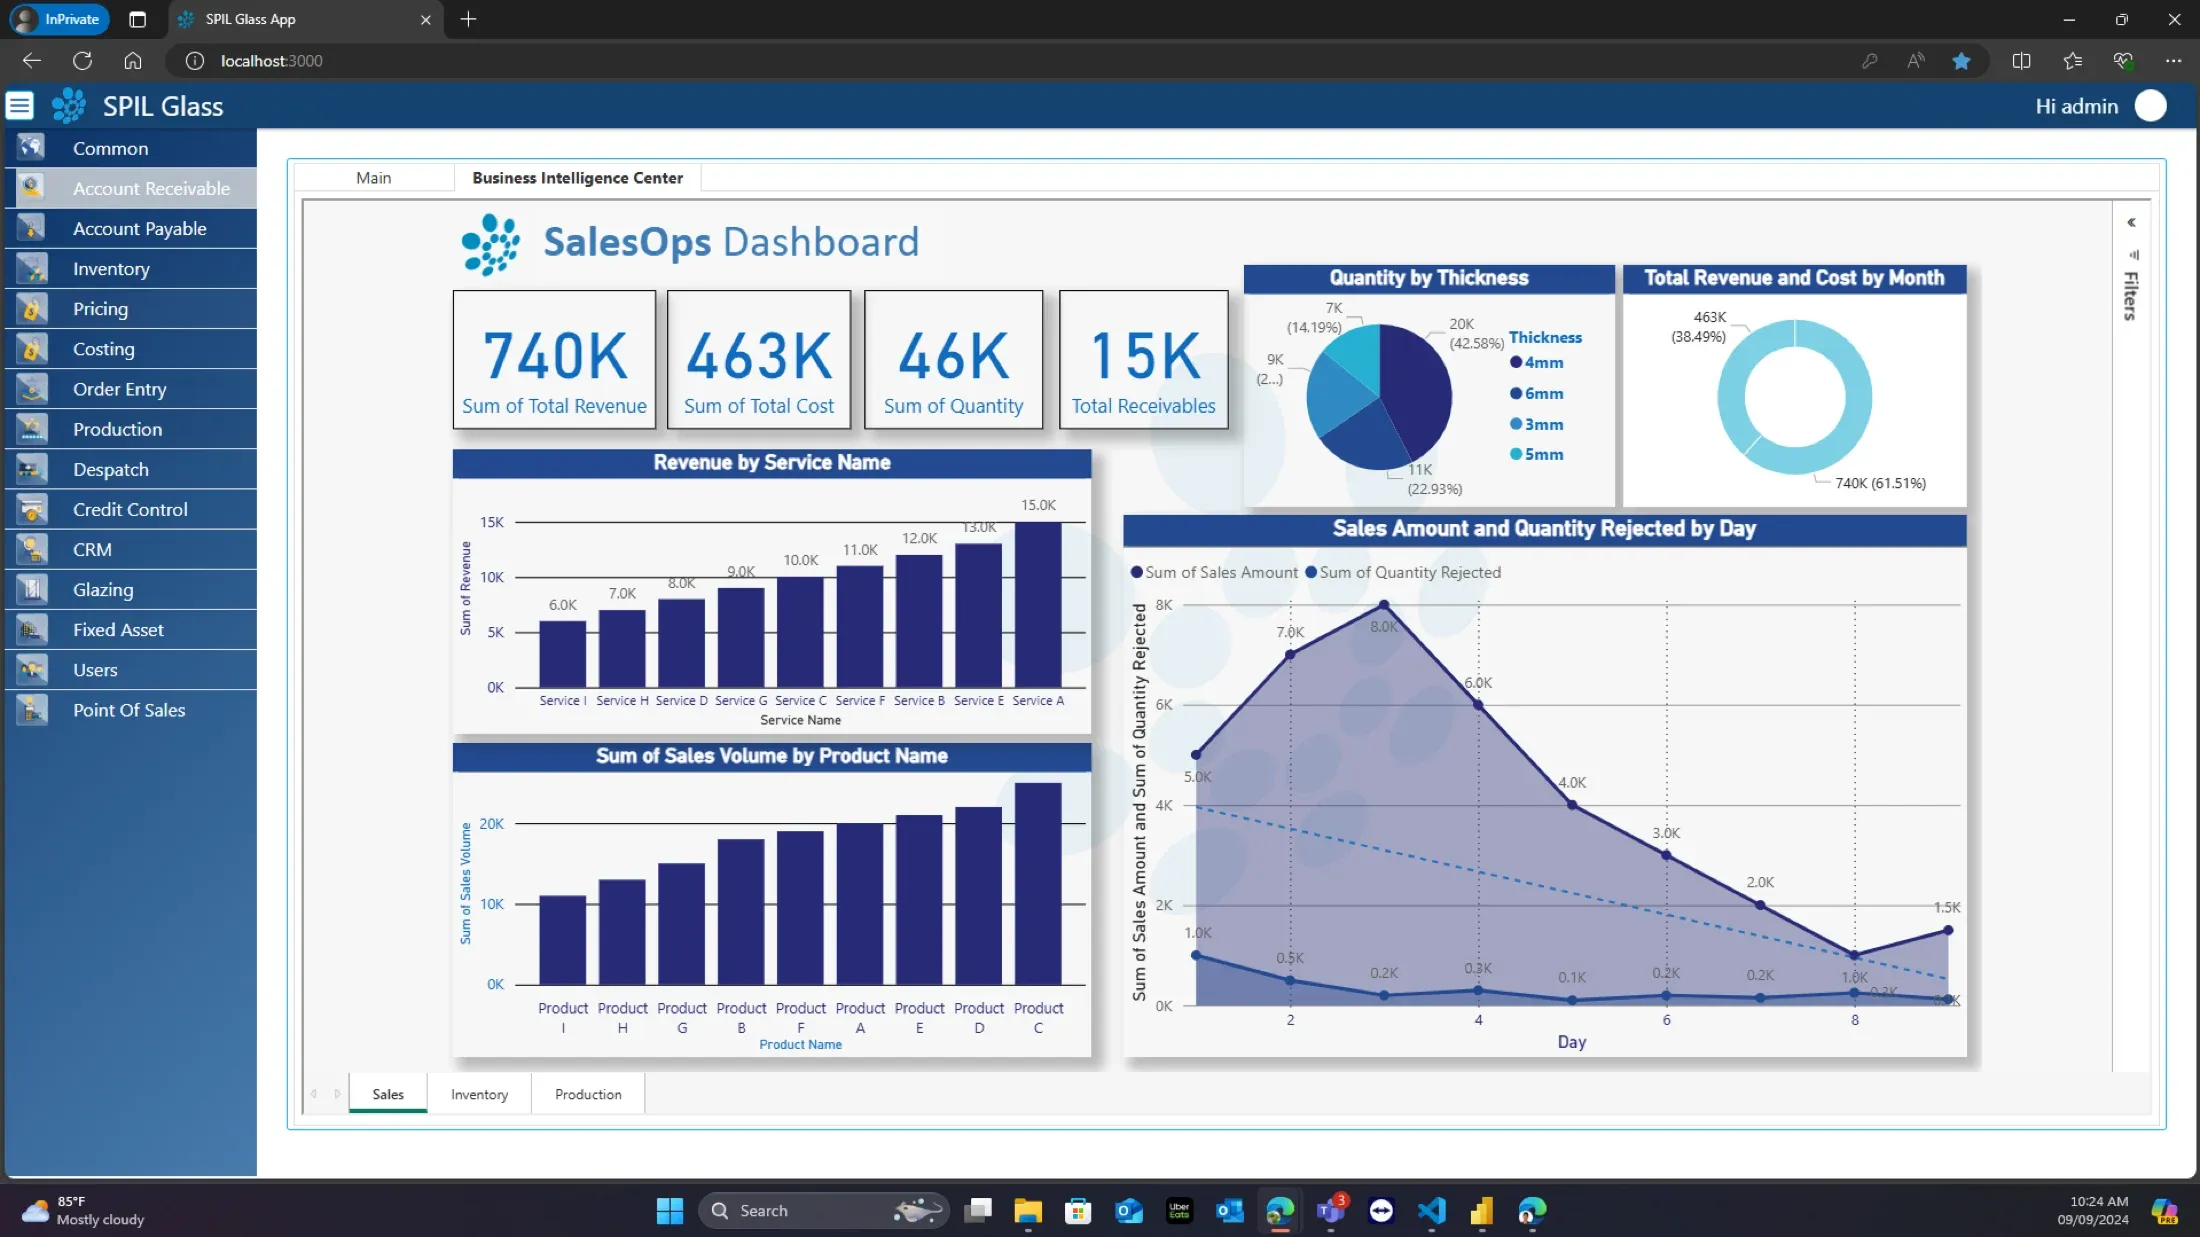
Track orders, sales and invoicing against budget, and see which customers and products drive your business.
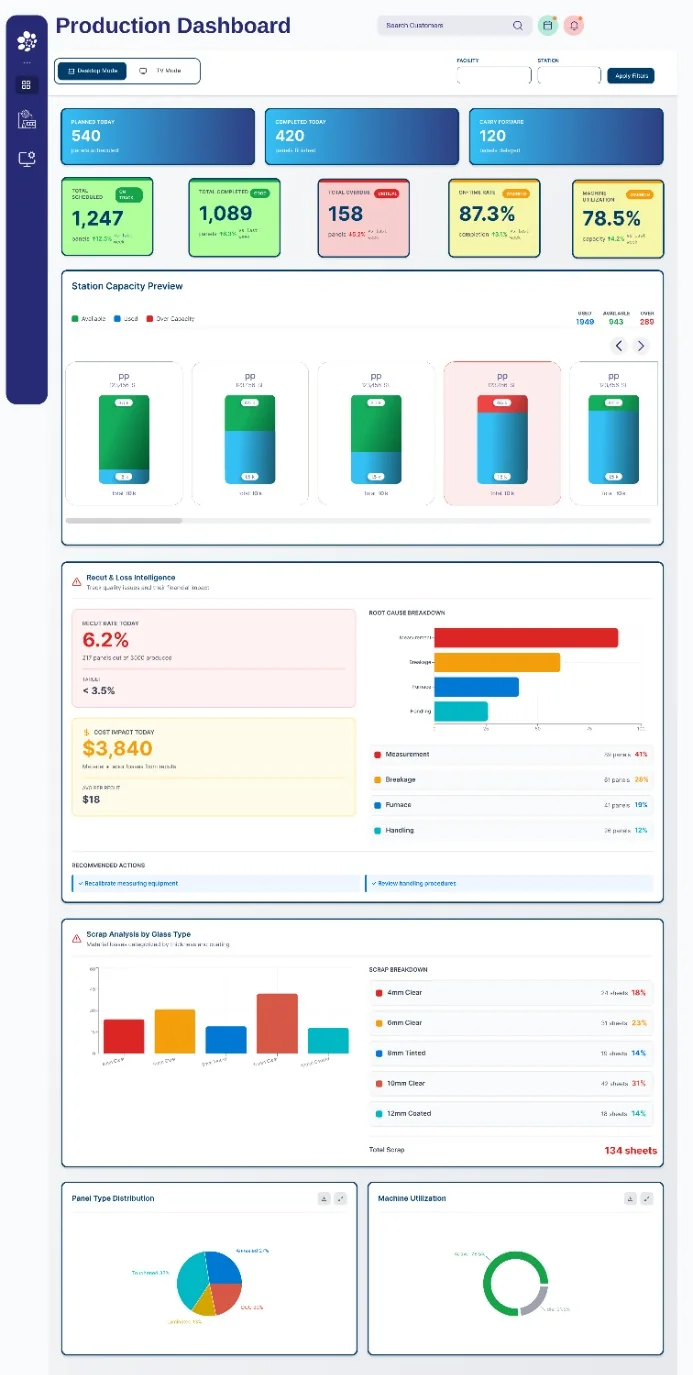
See what is planned, completed and overdue on the factory floor — with a TV mode for the shop floor and filters by facility and station.
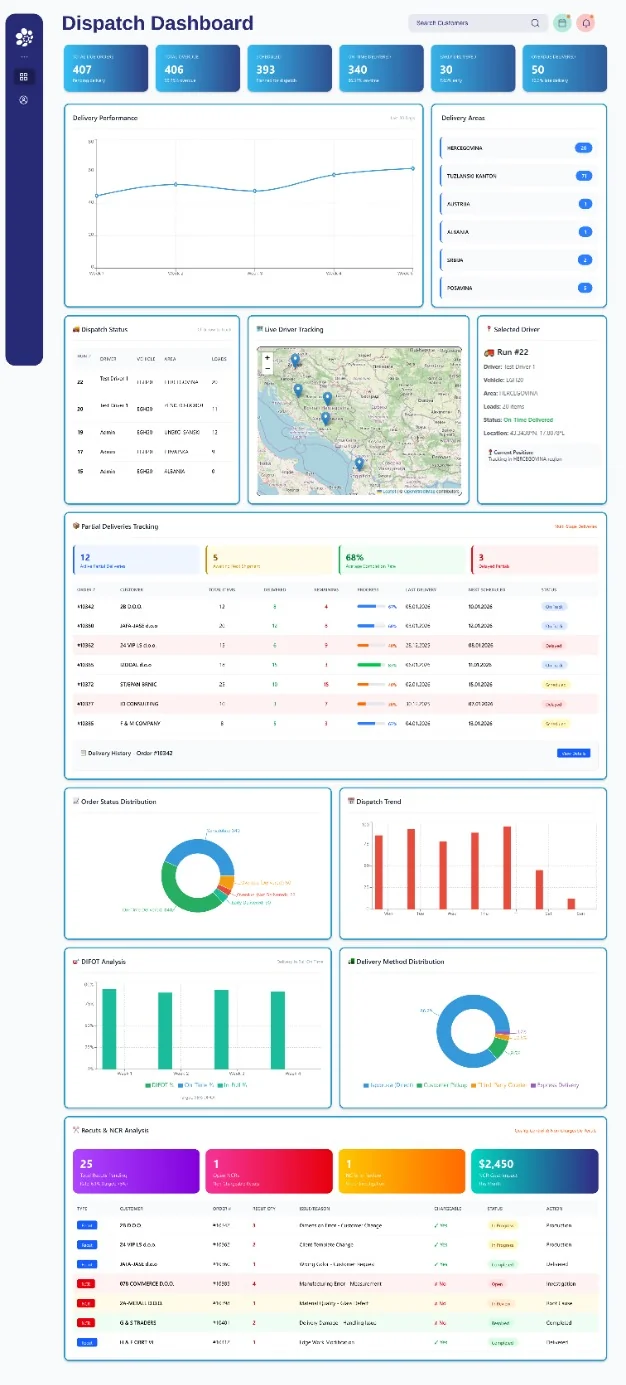
Follow every run from scheduling to delivery, with live driver tracking and the quality figures that matter to your customers.
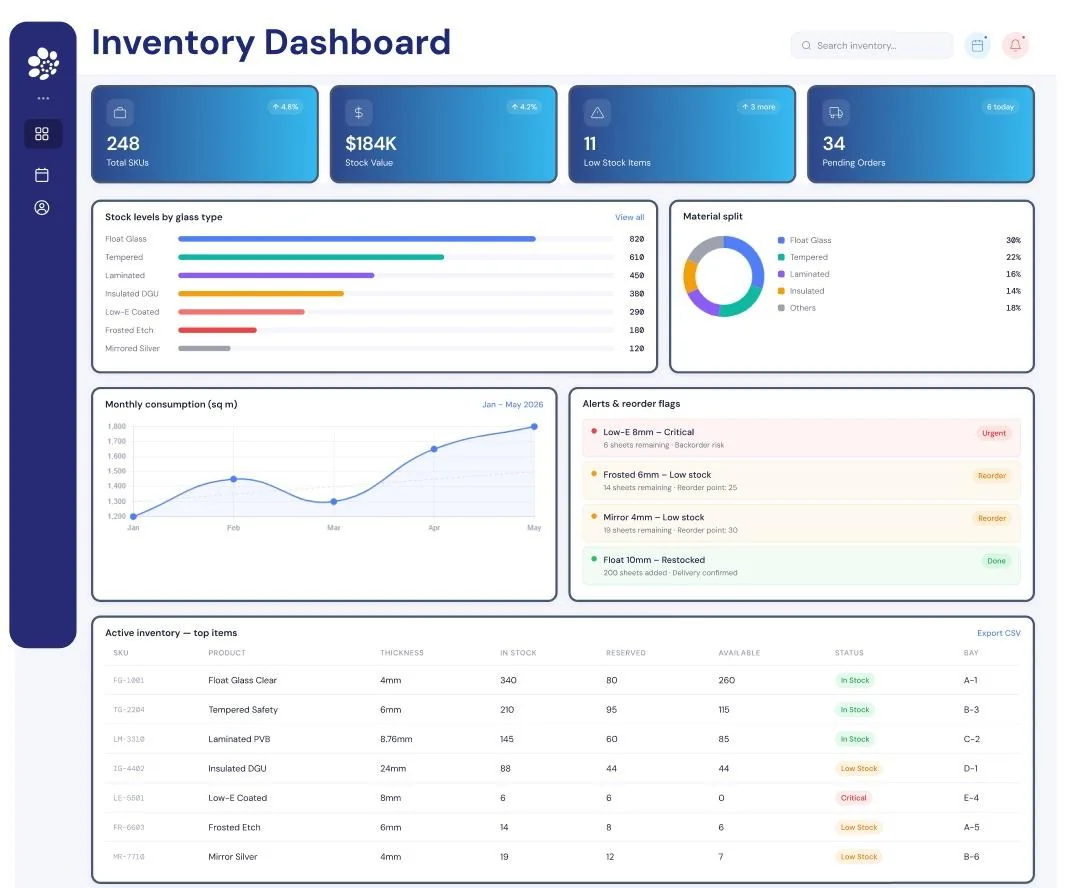
Keep glass stock under control, from stock levels and consumption to reorder alerts for each item.
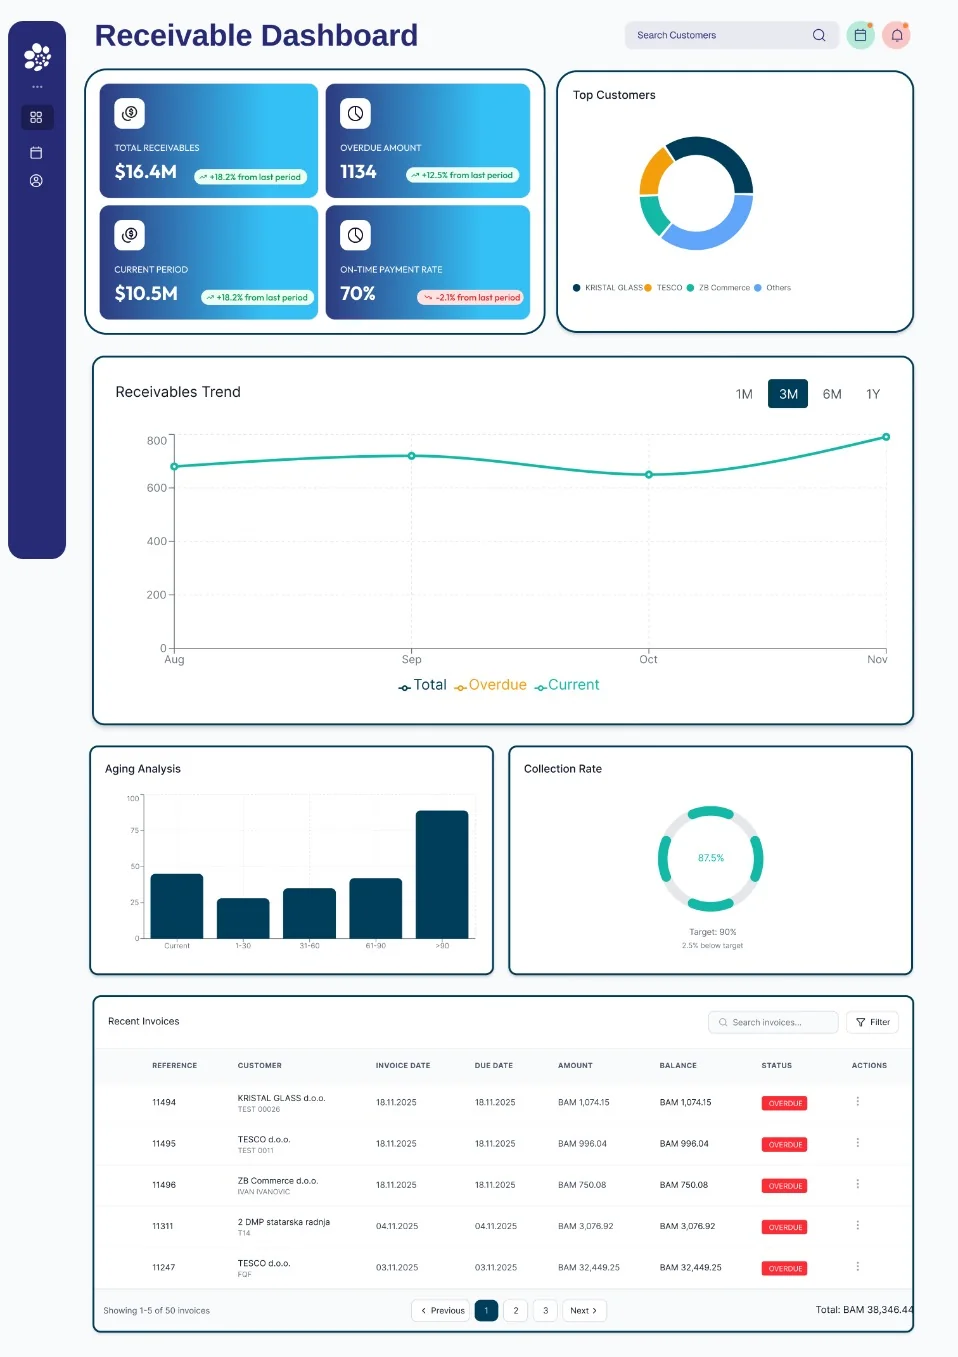
Stay on top of what customers owe you, what is overdue and how quickly invoices are paid.
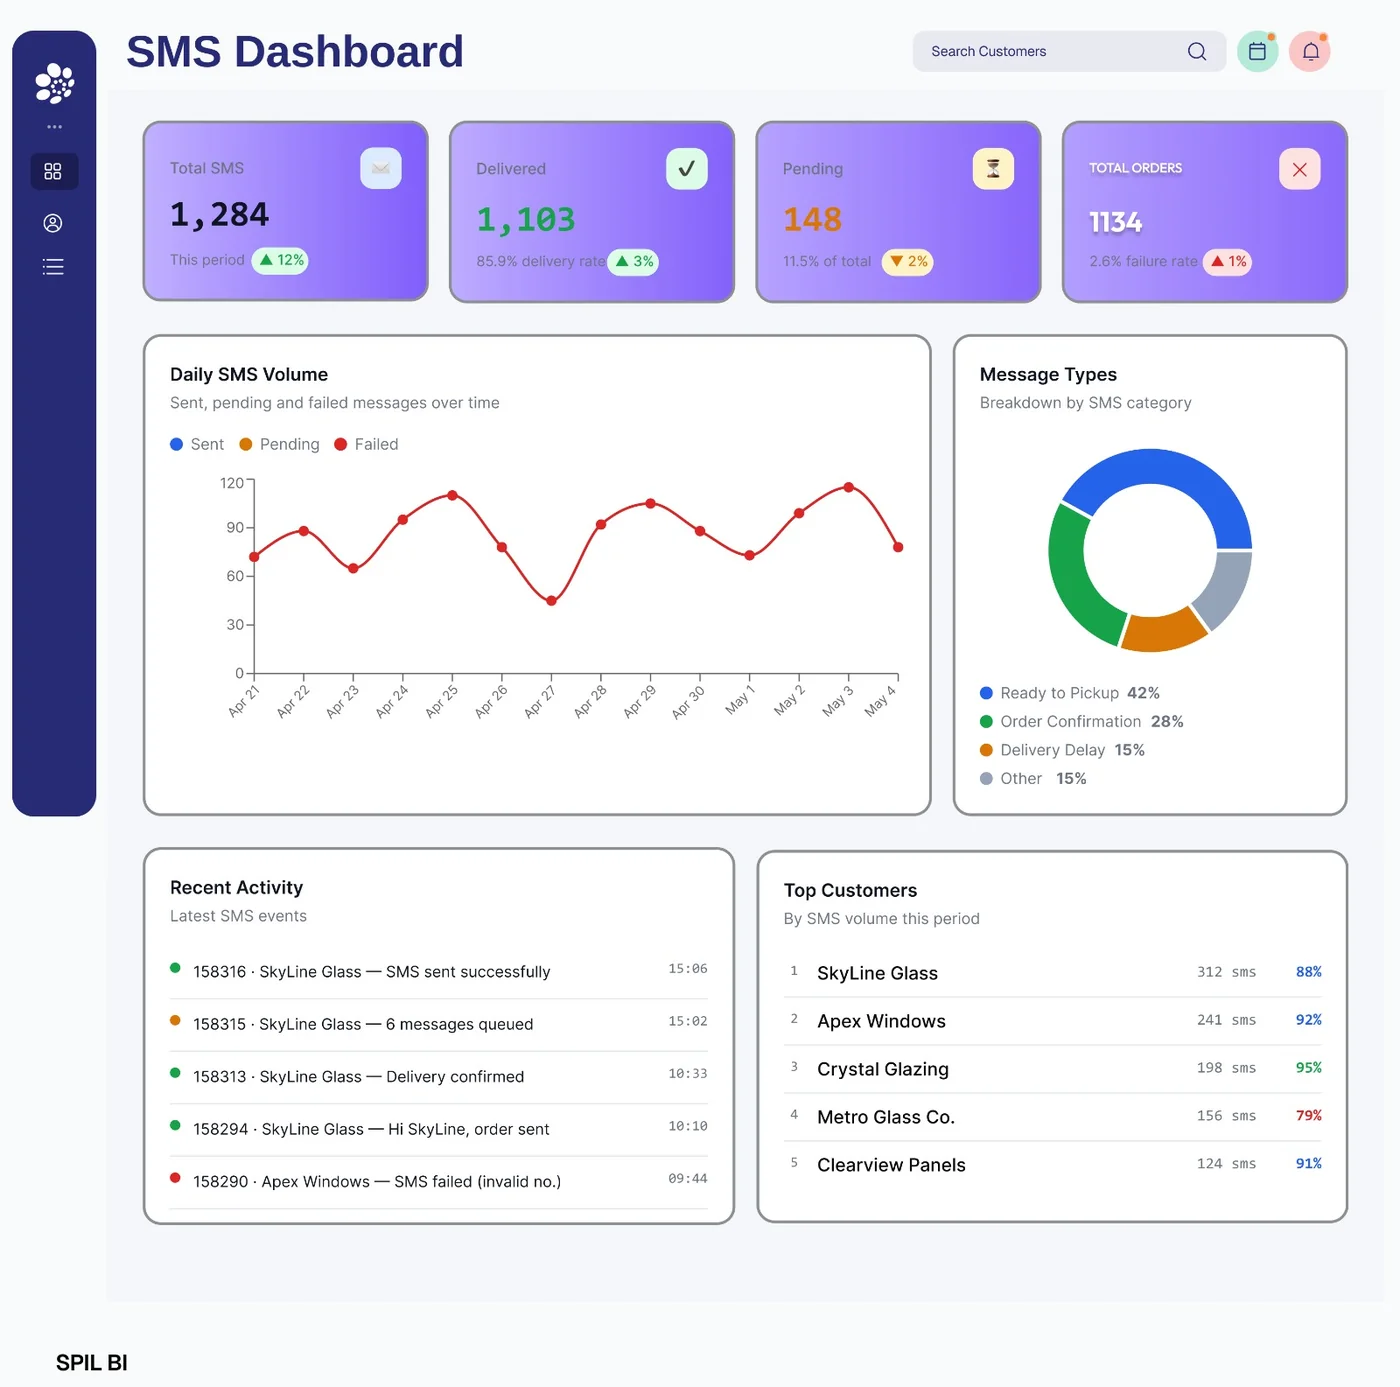
See how the automated customer SMS messages from the SPIL SMS module are performing.
Screens
Real screens from SPIL Power BI Dashboards. Select any screen to view it full size.
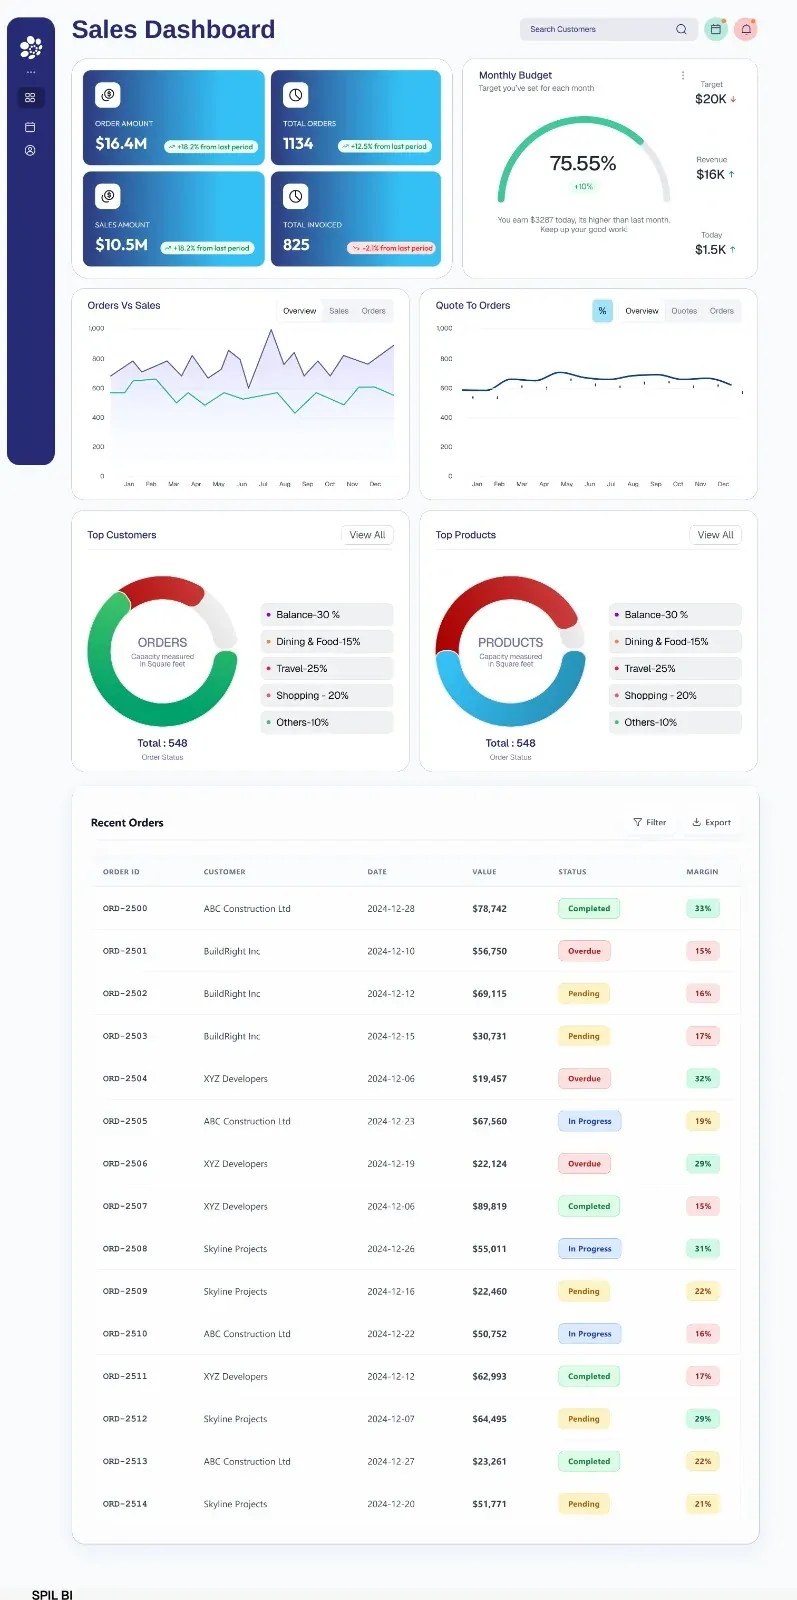
Sales dashboard
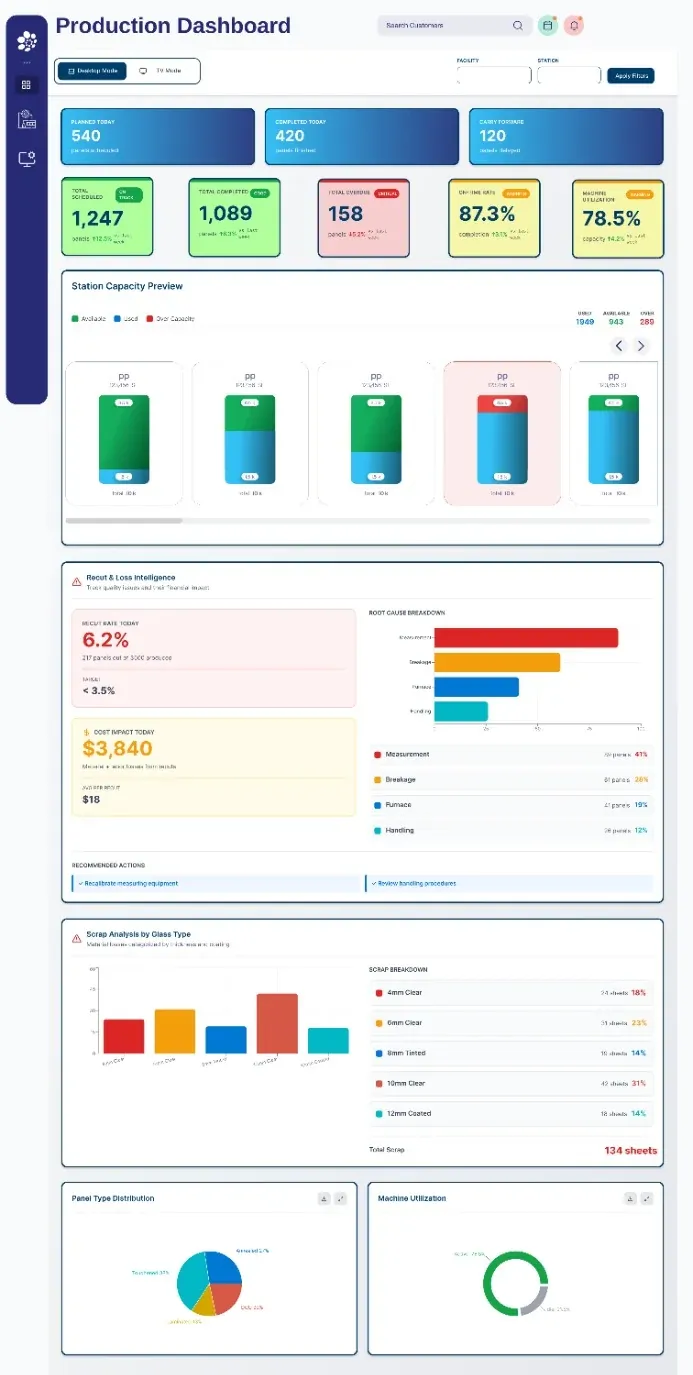
Production dashboard
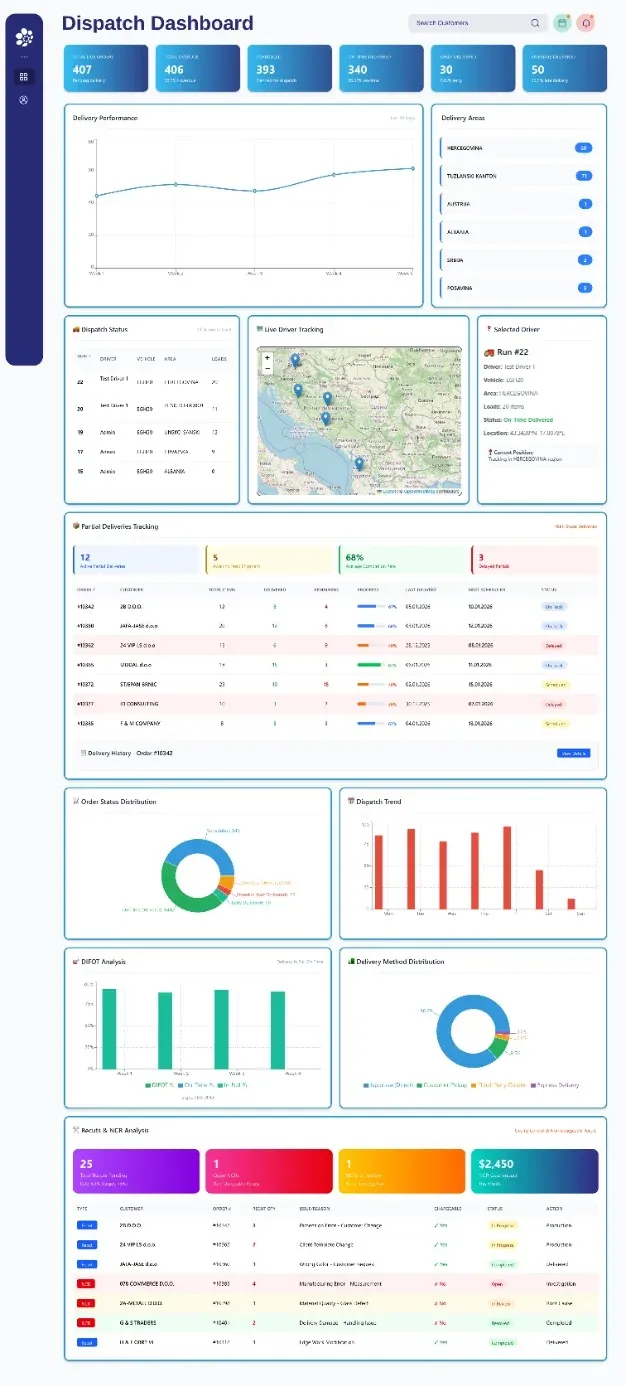
Dispatch dashboard
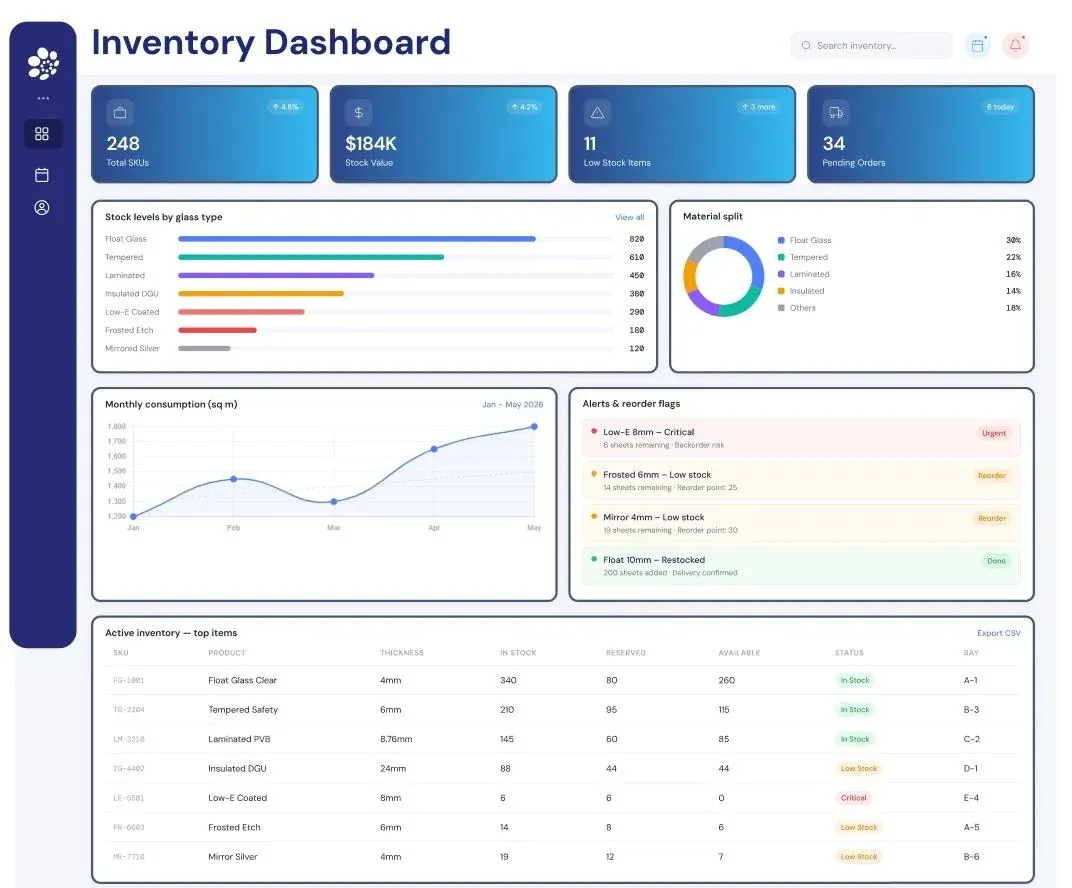
Inventory dashboard
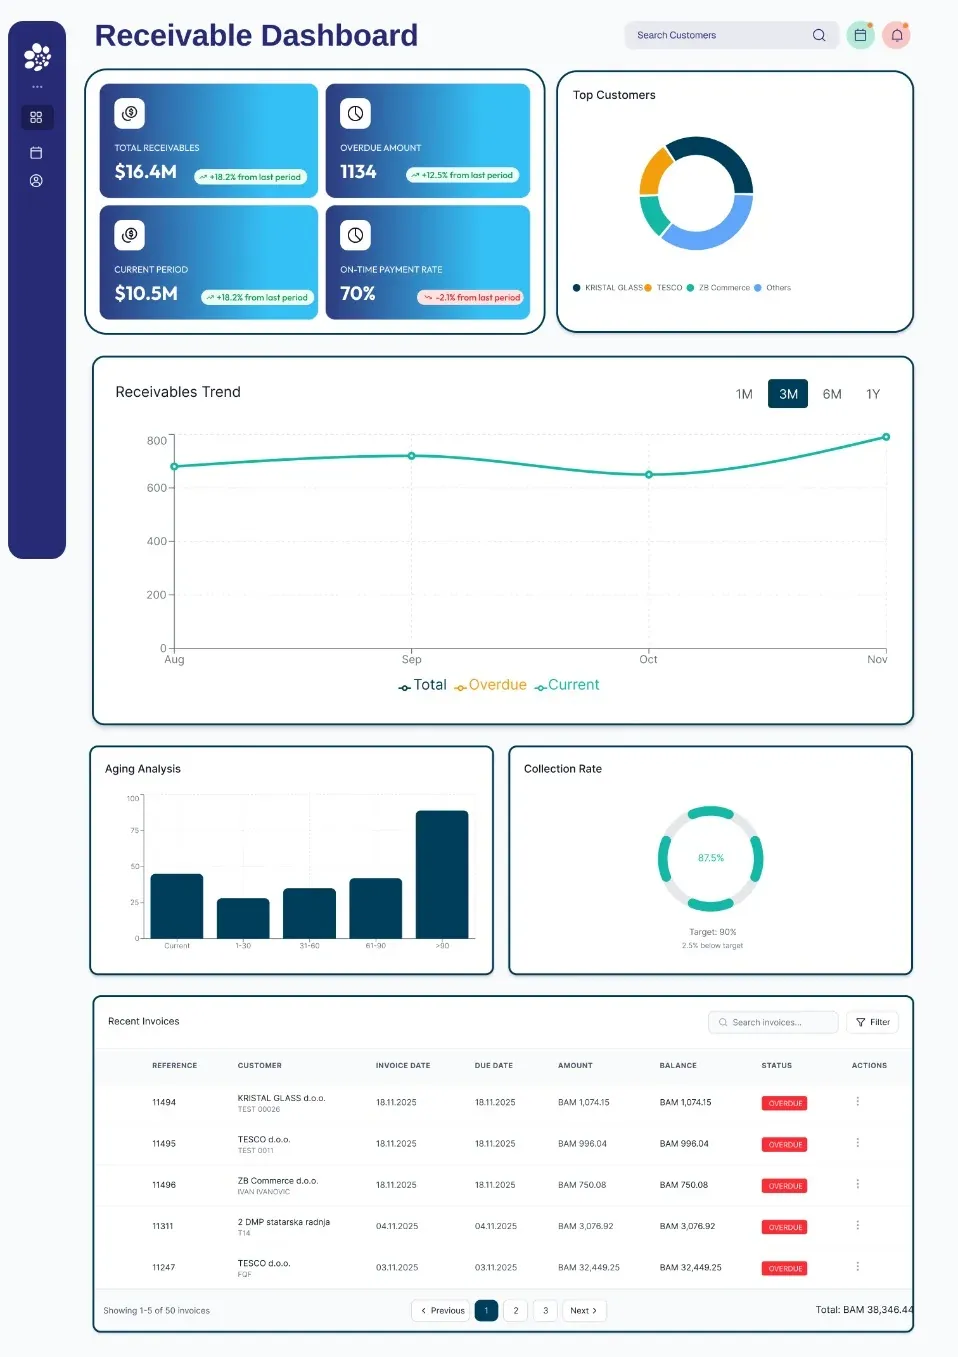
Receivables dashboard
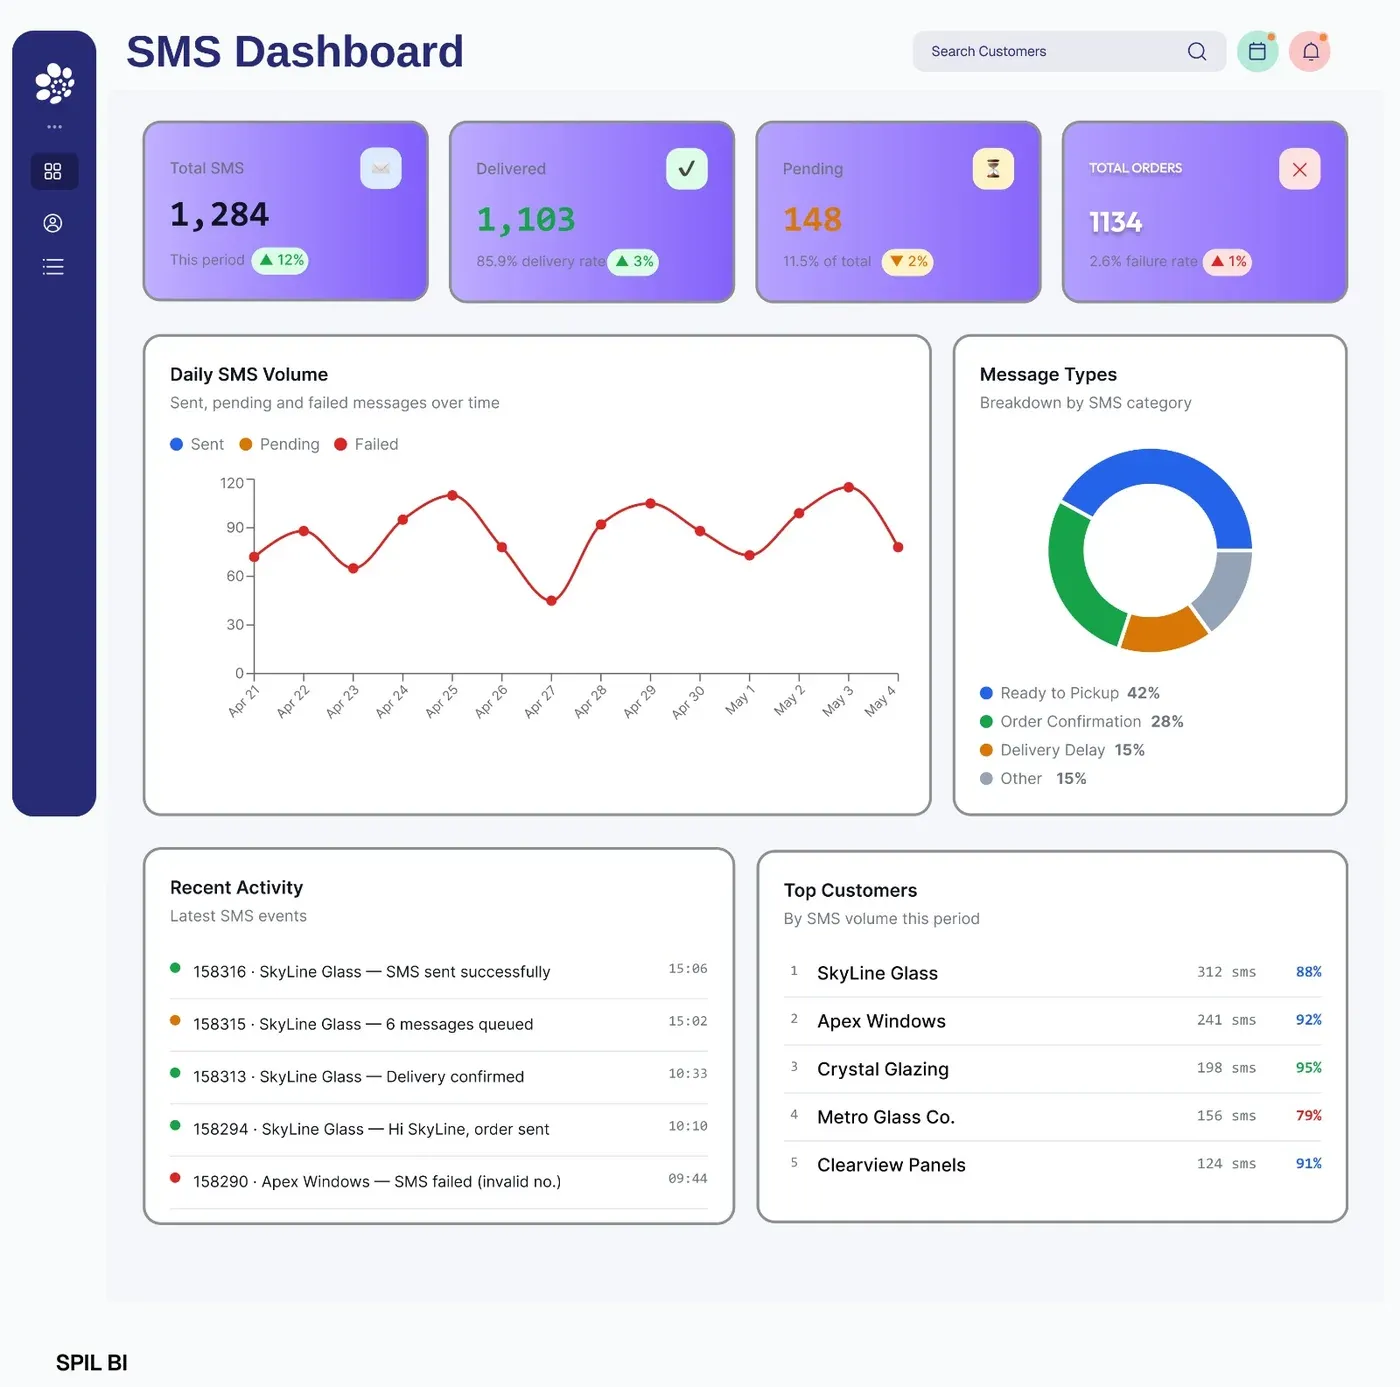
SMS dashboard
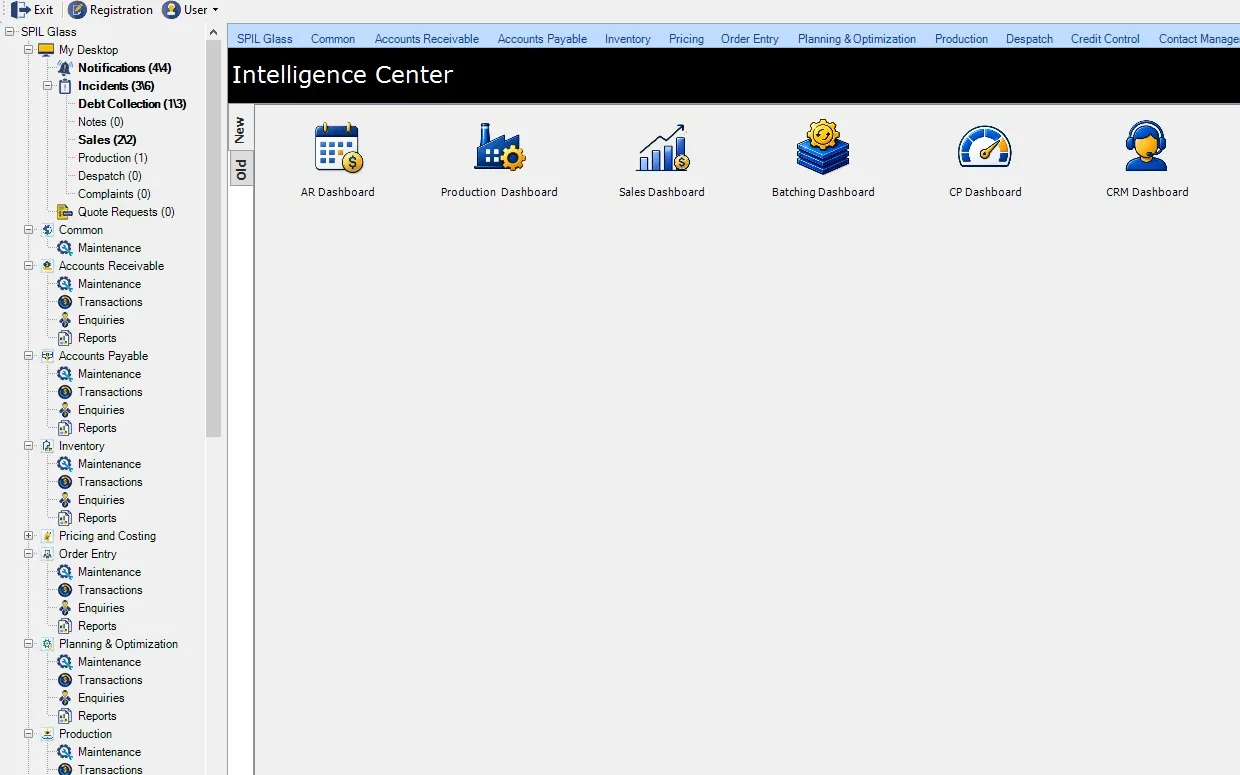
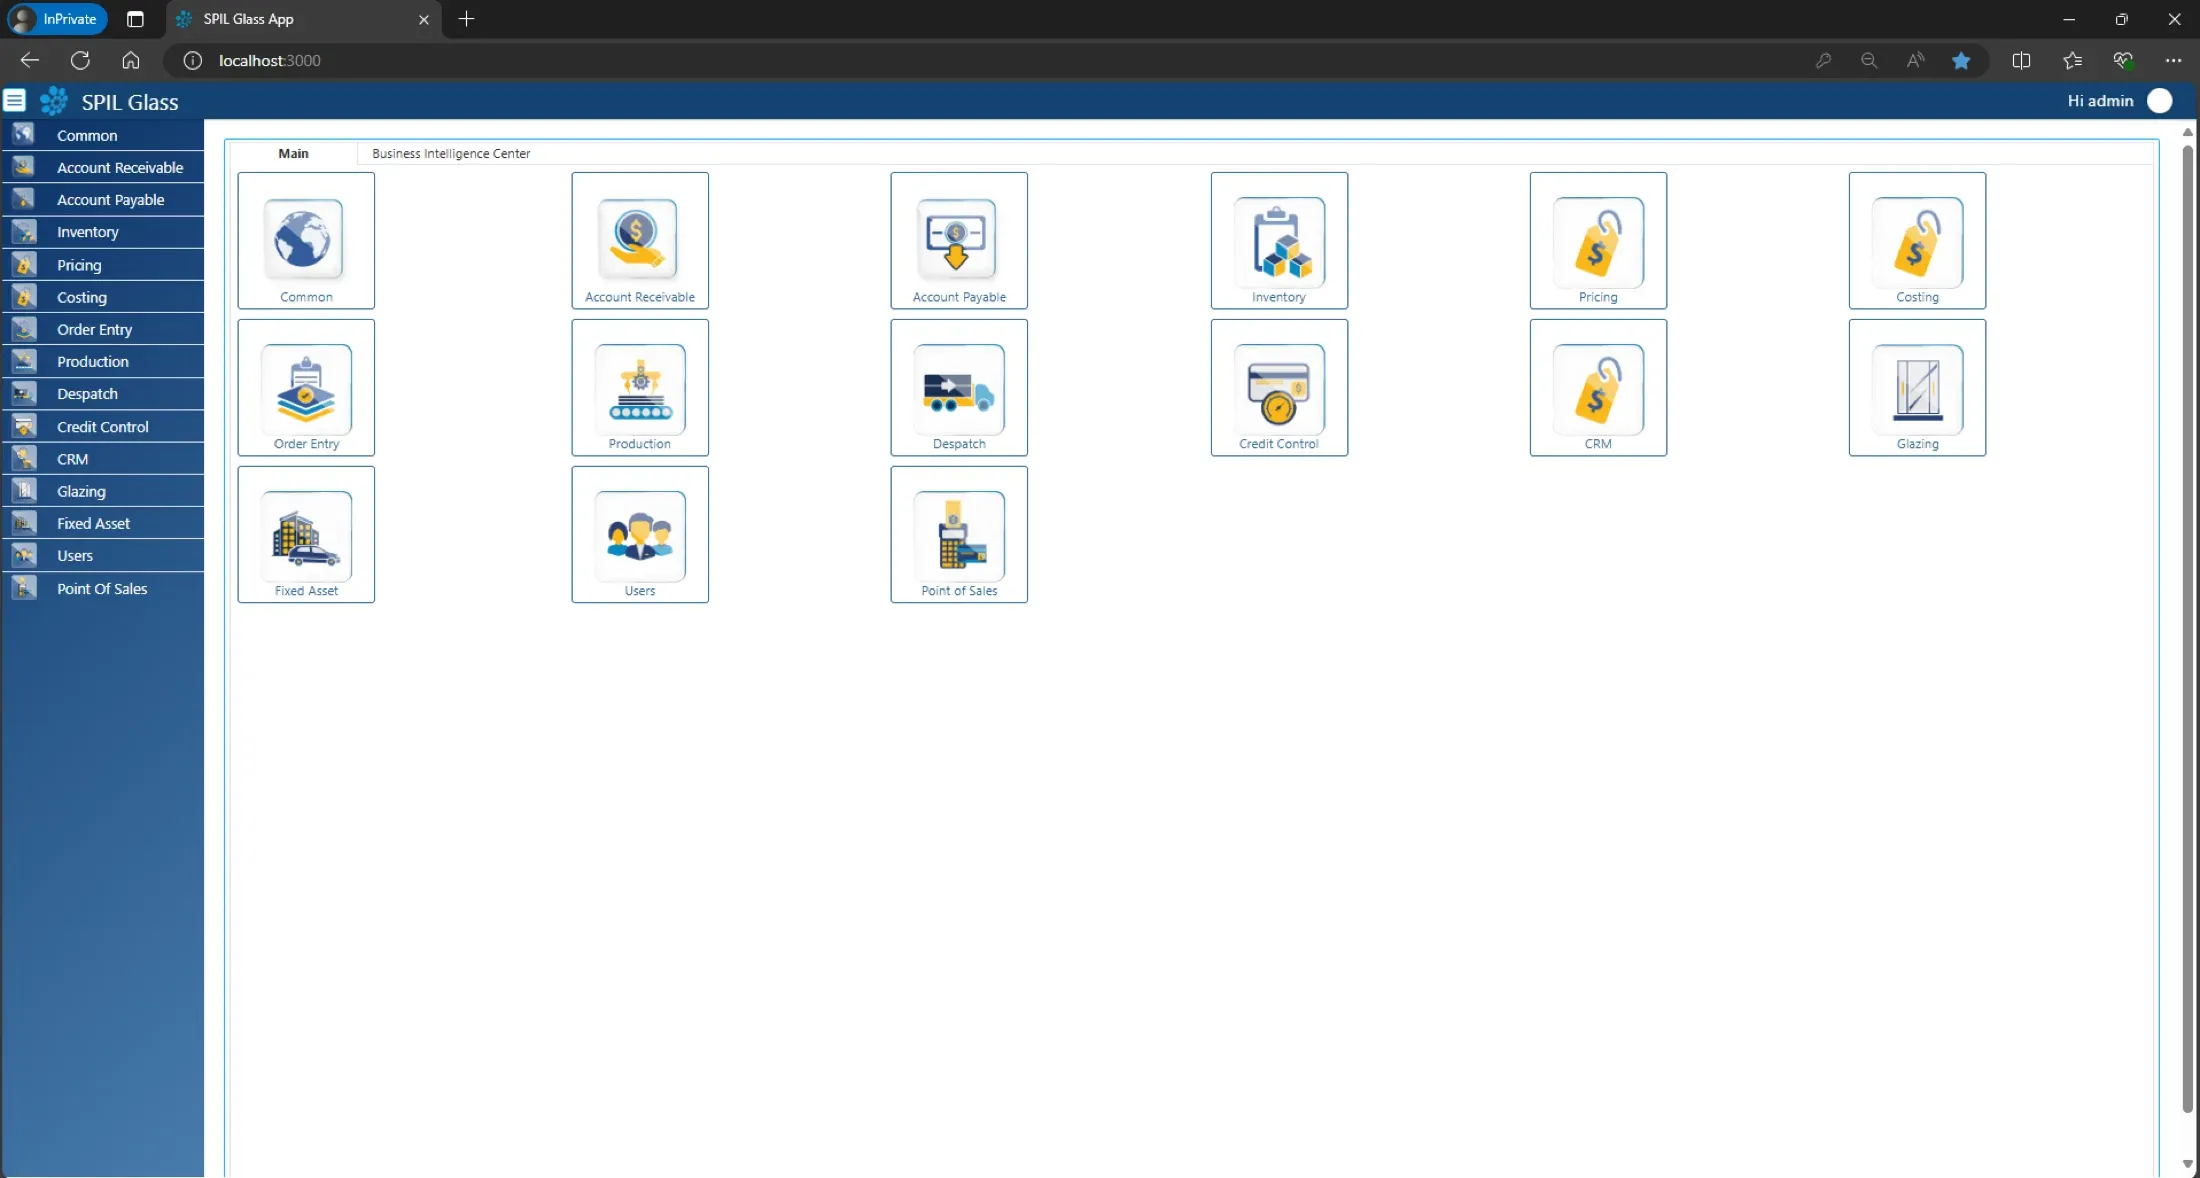
Intelligence Center — dashboards for every part of the business
Benefits & features
Real-time insight from your glass data.
With SPIL Power BI Dashboards, you get a powerful, intuitive and dynamic data experience tailored to your business needs. Stay ahead of the competition with data-driven decisions that matter.
SPIL Power BI DashboardsReal-time insight from your glass data
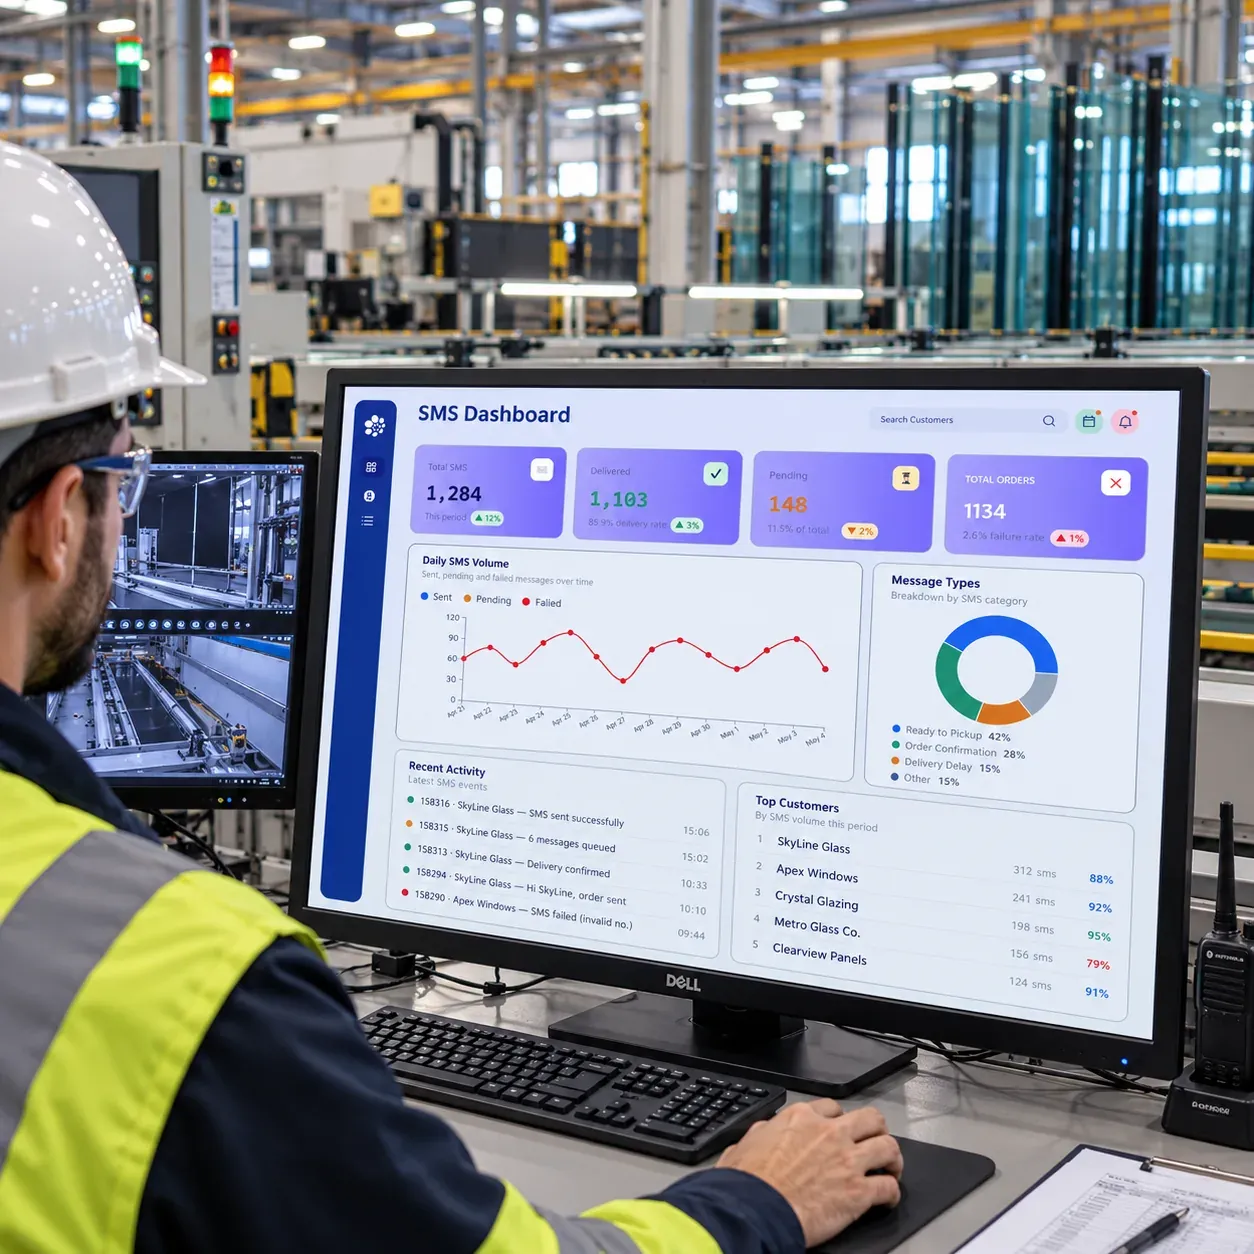
Keep exploring
More from the SPIL platform to complement SPIL Power BI Dashboards.
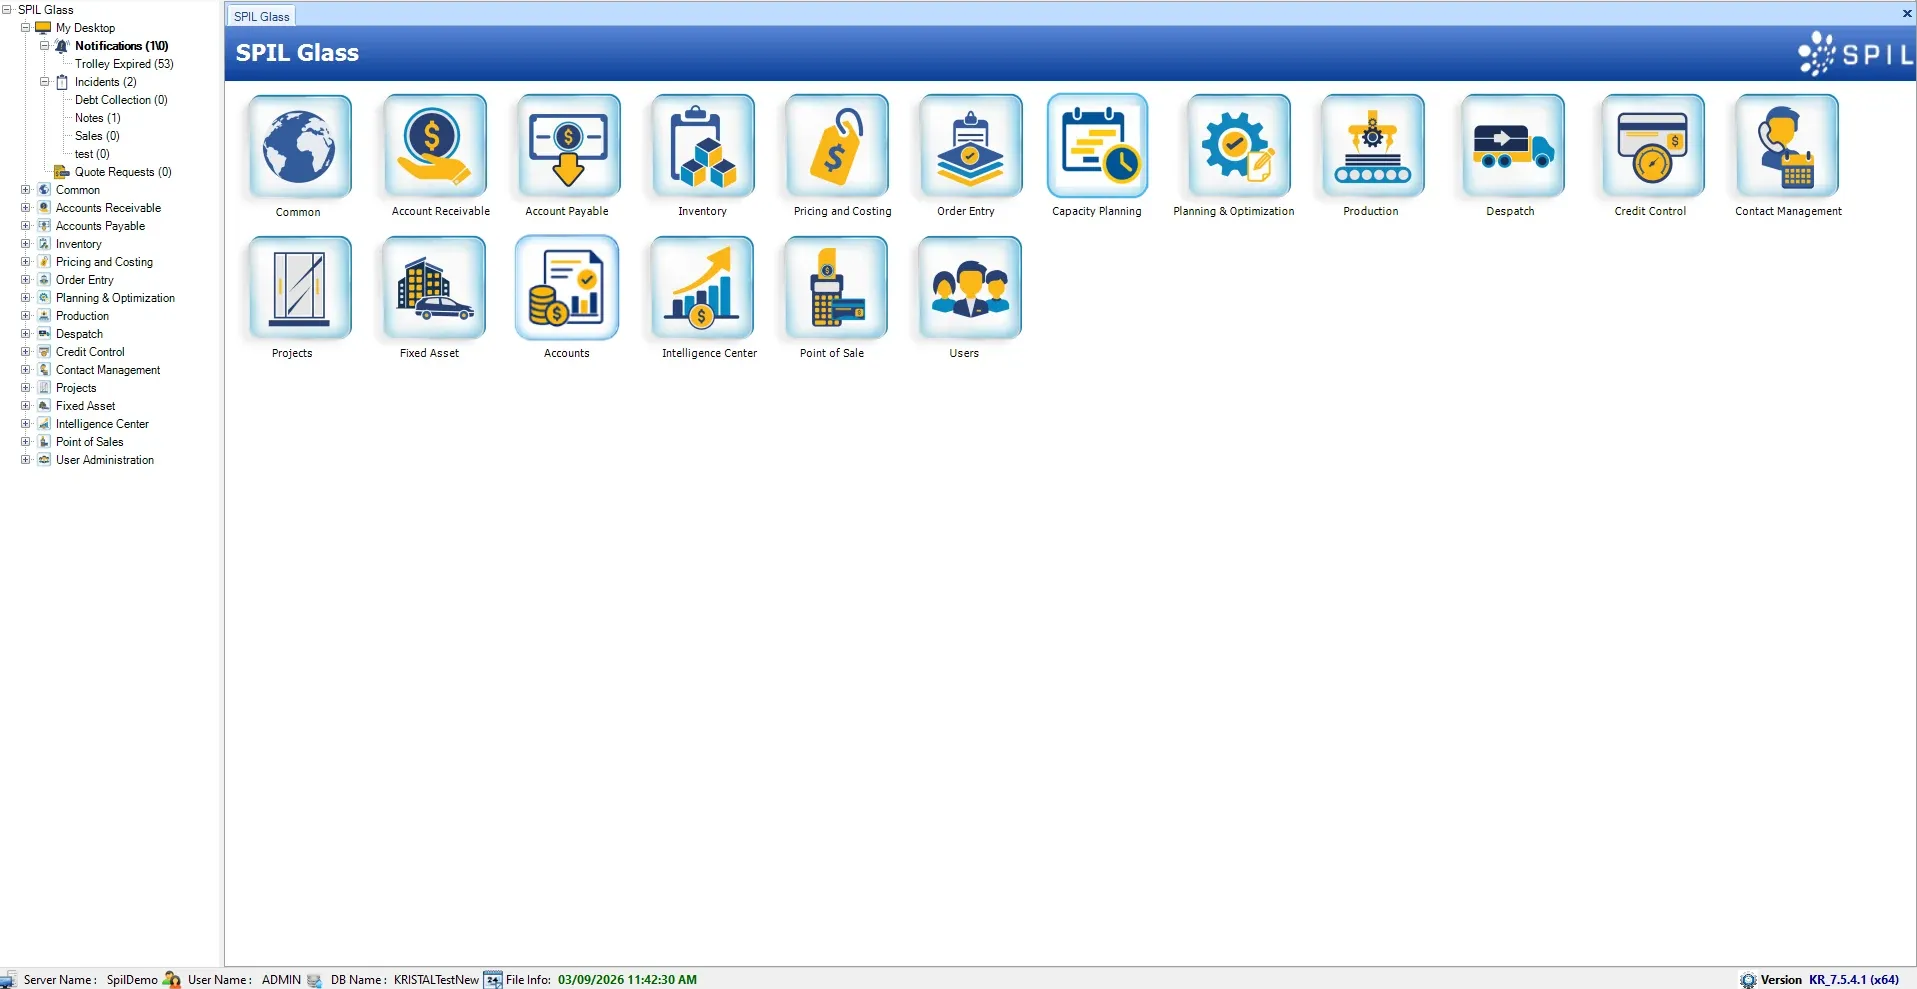
Order entry, production, inventory, costing and despatch in one connected system for flat glass fabricators — scaling from 1 to 1,000 users.
Glass ERP in the cloud with multi-factor login, access from any platform and no on-premise hardware to maintain — ideal for smaller fabricators, glaziers and installers.
A CRM made for the flat glass industry and fully integrated into SPIL ERP — track leads, automate follow-ups and send emails and SMS from one place.
Get started
Book a free demo and our team will walk you through SPIL Power BI Dashboards — and how it fits with the rest of your operation.
Prefer to talk?AU+61 390 000 065US+1 479 569 4400